
.png)


Imagine you’re the proud owner of a hipster coffee brand. Your artisanal beans are the talk of the town, and your Instagram-worthy packaging has influencers buzzing. You're staring hard at your sales dashboard, and something's not quite right.
New customers are pouring in faster than a barista can say "venti triple shot no-foam latte," but your overall revenue isn't growing as it should. In fact, it's barely keeping pace with your customer acquisition costs. While you're pouring resources into attracting new customers, existing ones are slipping away through the cracks.
You've got a classic case of churn, my caffeinated friend!
Churn is not just a minor inconvenience—it's a significant threat to your business's sustainability and profitability. It's the very reason why your impressive customer acquisition numbers aren't translating into the revenue growth you expected.
Understanding and reducing churn should be a top priority for any D2C brand. But don't worry. There's a powerful tool at your disposal: cohort analysis. It's time to tackle that churn head-on and boost your customer retention.
Cohort Analysis: Your secret weapon
Think of it as a method to understand your customers' behavior over time. It involves grouping customers based on shared characteristics and tracking their behavior over time.
Here's why cohort analysis is crucial for customer retention:
- It reveals patterns over time (like when customers tend to churn)
- It helps you identify your most loyal customers
- It shows the impact of your actions (Did that new campaign boost retention or drive people away?)
What your cohorts are telling you: An example
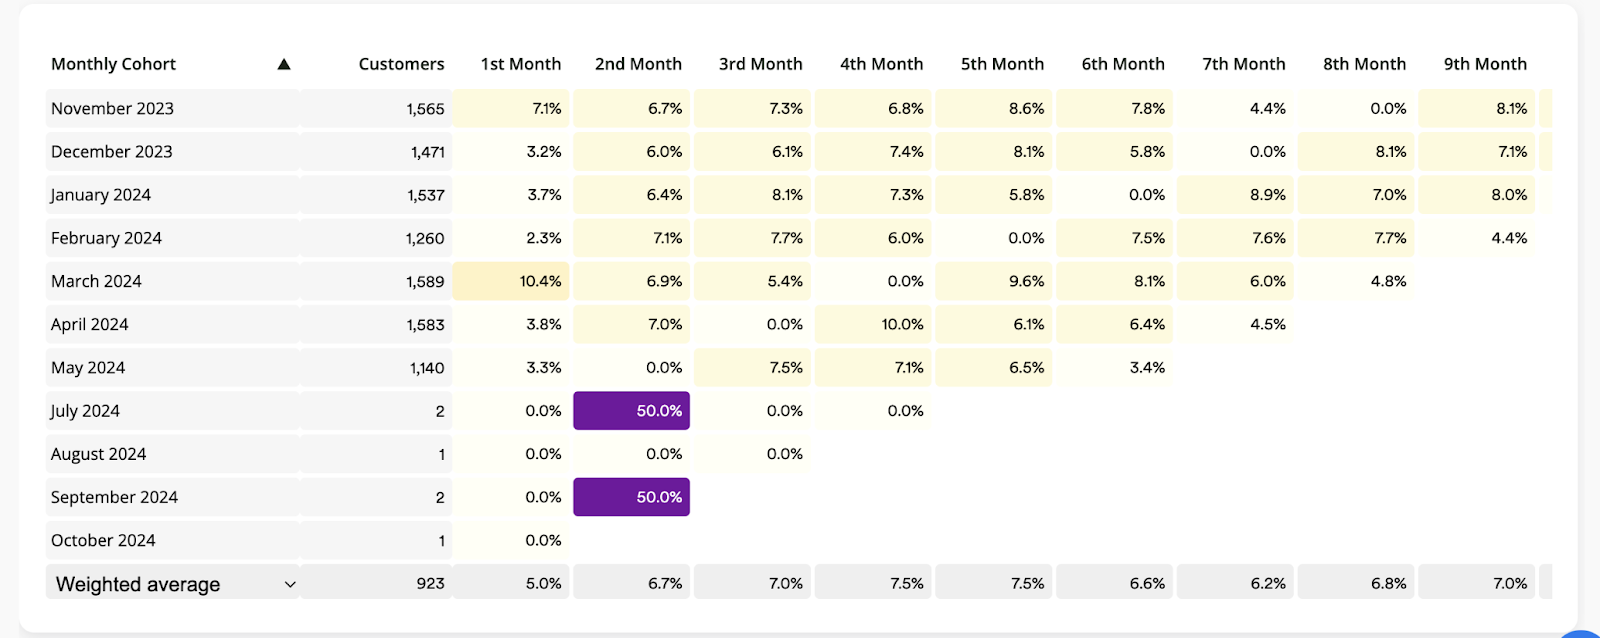
Let's say you're looking at a retention rate chart for different cohorts. We’ll pick the monthly time interval for this.
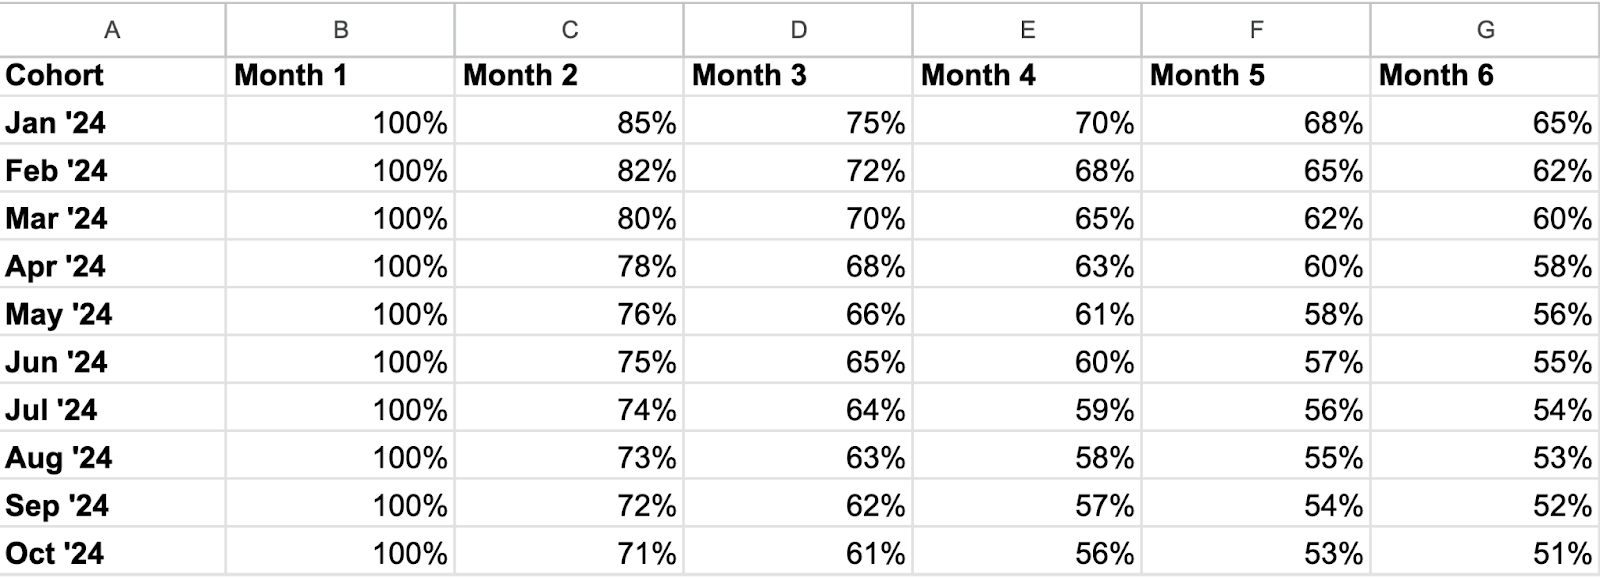
Here’s what the retention curve looks like:
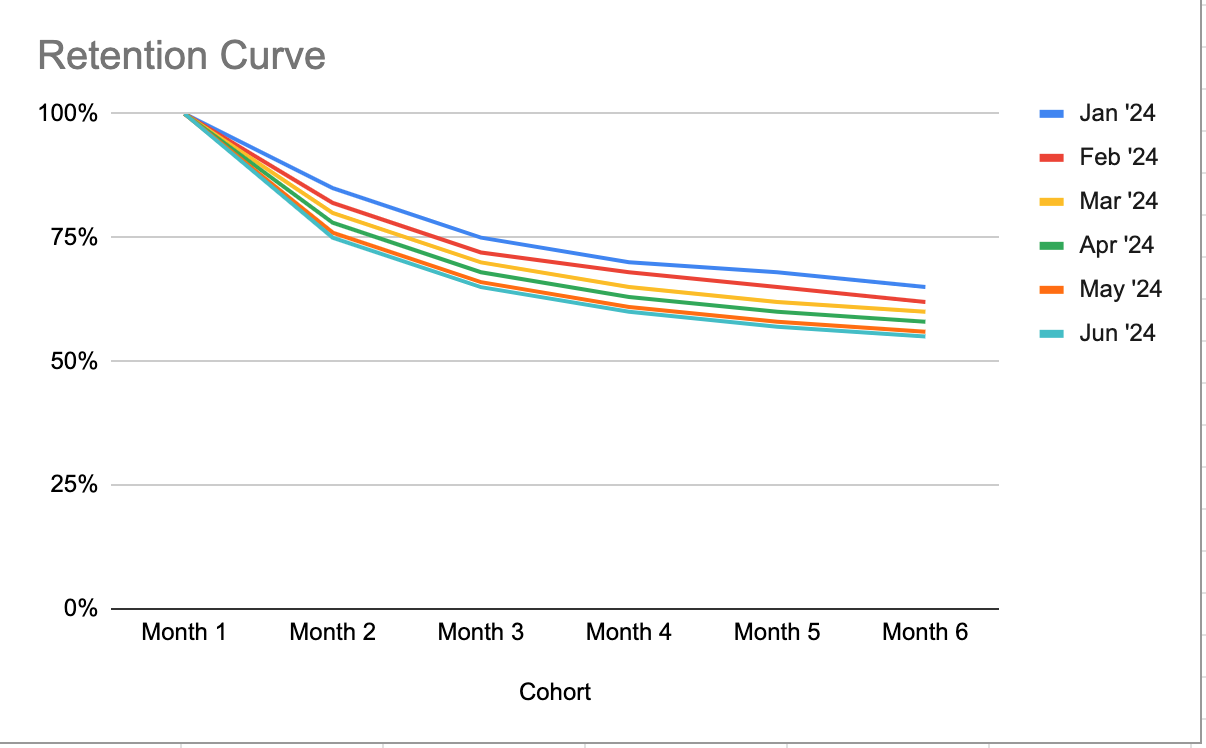
The story often lies in the patterns and trends that emerge over time. The data reveals three distinct phases in the customer lifecycle:
- High-Risk Period (Months 1-2): Highest churn rate, losing 15-29% of users
- Stabilization Period (Months 2-3): Moderate churn of 7-10%
- Loyalty Phase (Months 4-6): Lower churn rate of 2-5% per month
Looking at our cohort analysis from January to October 2024, several critical insights emerge:
- The first-month drop: The most striking pattern is the significant drop-off between Month 1 and 2. This initial churn has been worsening over time – while our January cohort lost 15% of users in this period, our October cohort is projected to lose 29%. This "first-month cliff" represents a critical challenge that needs immediate attention.
- The Three-Month Mark: Customers will most likely churn in the first three months. This period is crucial for establishing customer loyalty.
- Declining Retention: Each new cohort has slightly worse retention than the last. This could indicate a decline in product quality, customer service, or increased competition.
- The Loyal Core: After month 4, retention stabilizes. This pattern suggests that if you can keep customers past Month 4, they're significantly more likely to become long-term users.
Setting Up Your Cohort Analysis
Let's get practical. How do you set up cohort analysis to tackle churn?
Step 1: Choose Your Cohorts
Cohort analysis is a powerful tool, but its effectiveness lies in how you define and use your cohorts. Decide how you want to group your customers. For most D2C brands, the most common approach is by joining date or first purchase date.
For example:
- January 2024 Cohort: All customers who made their first purchase in January 2024
- February 2024 Cohort: All customers who made their first purchase in February 2024
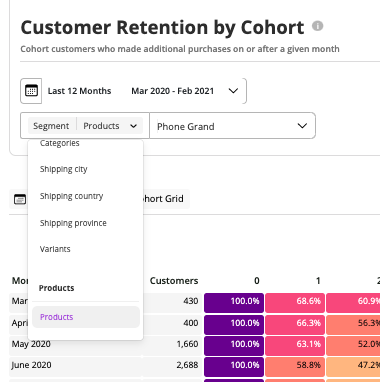
Here are a few other ways to build your cohorts:
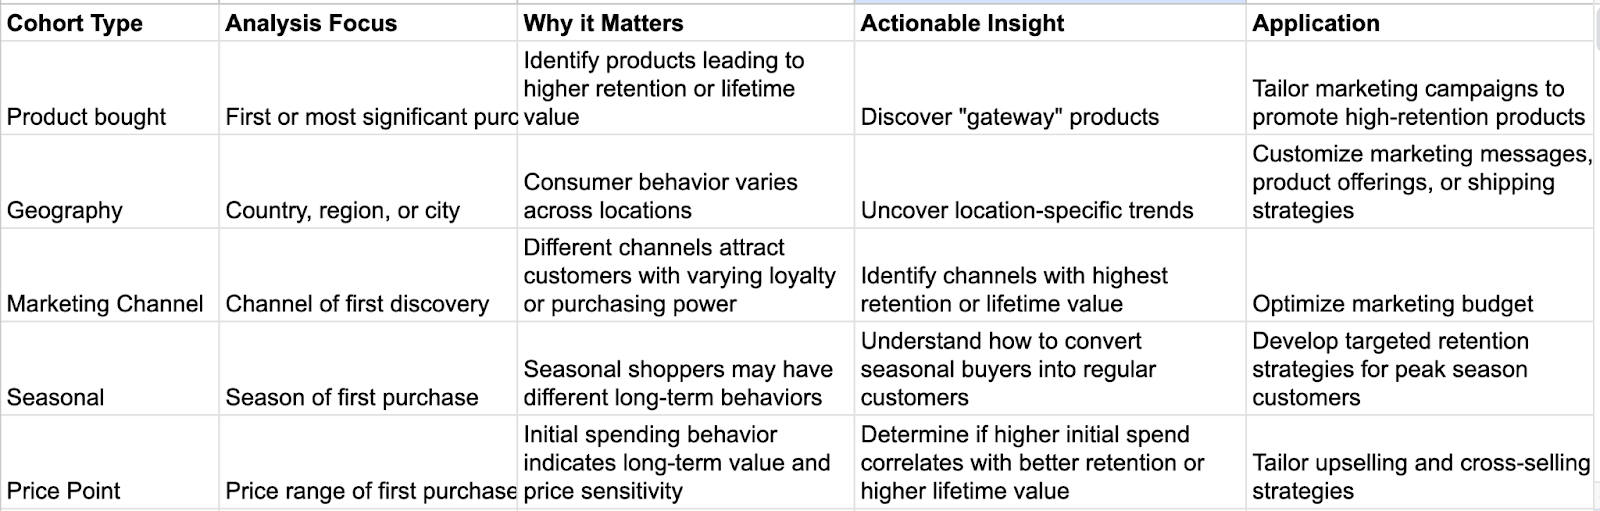
Grouping customers this way helps you compare how different cohorts perform over time, providing a clear picture of customer retention and engagement.
Step 2: Pick Your Metrics
Next, decide what you want to measure. For churn prevention, focus on:
- Retention rate: The percentage of customers still active after a certain period
- Churn rate: The opposite of retention (100% - retention rate)
- Average order value (AOV): Are your remaining customers spending more or less over time?
- Purchase frequency: How often are they making repeat purchases?
- Repurchase rate: The percentage rate of a cohort having placed another order within 30/60/90/180/360 days from their first order.
Track these metrics on a monthly or quarterly timeframe, so you can identify patterns and trends that indicate the overall health of your customer base.
Step 3: Choose Your Time Frame
Decide how long you want to track each cohort. For a typical D2C brand, you might look at:
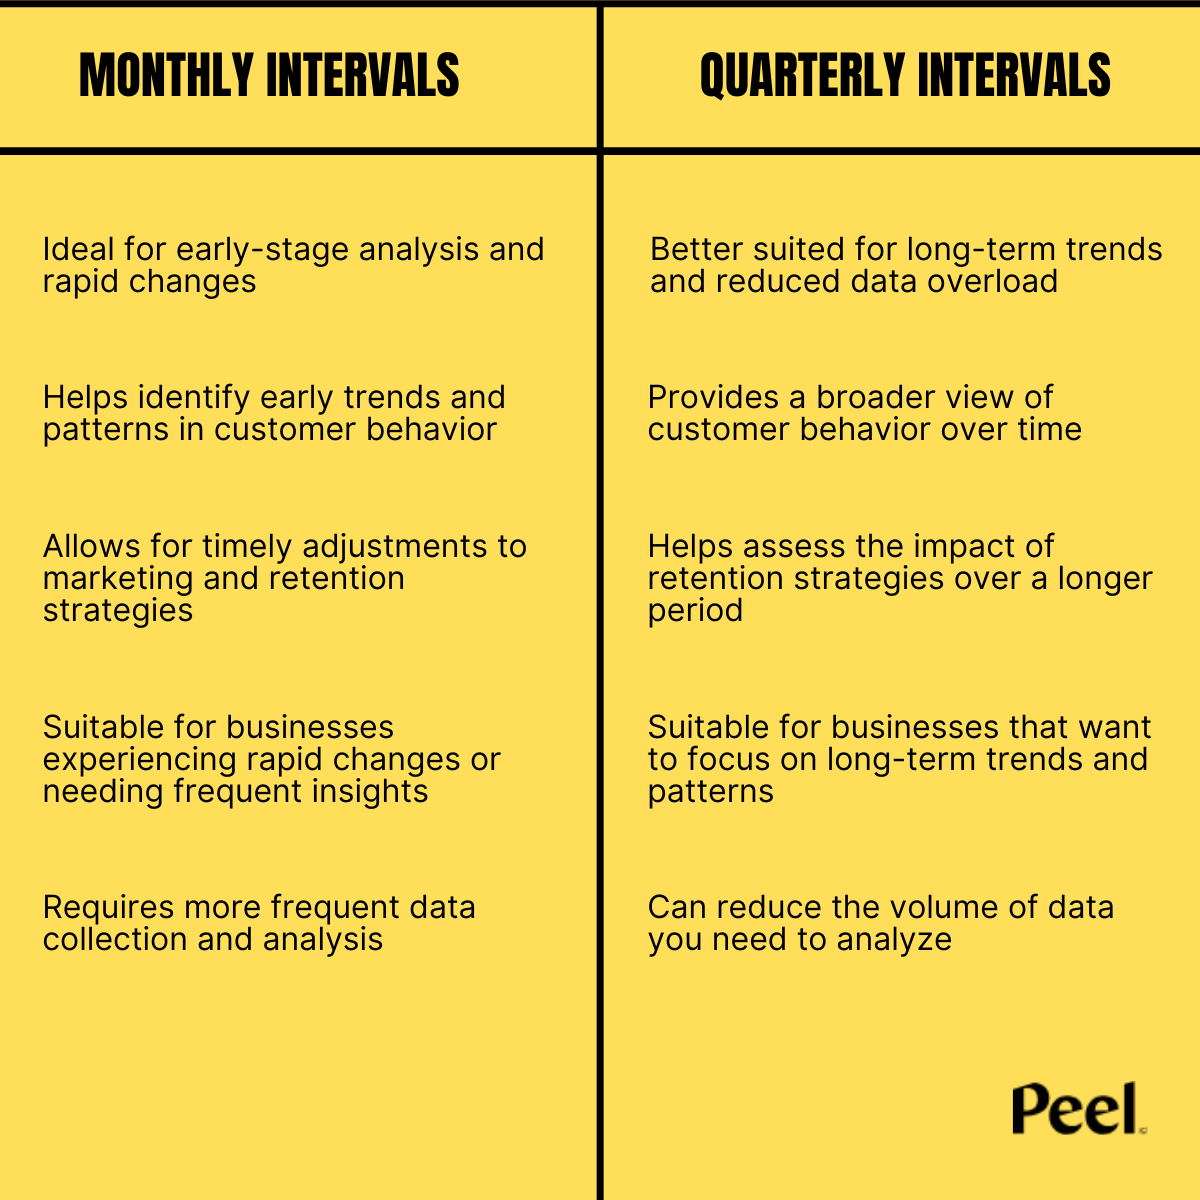
- Monthly intervals for the first 6 months
- Quarterly intervals after that
Finding the right balance between detail and trends is the key to effective cohort analysis. While monthly tracking provides granular insights into early customer behavior, quarterly tracking helps you maintain a clear overview of long-term trends.
Note: Remember, the goal is to spot trends; avoid getting lost in excessive detail. This is especially true when the purchase cycle is longer and your products aren’t impulse buys.
Step 4: Interpreting the Data
Now that you’ve set up your cohort analysis, it’s time to interpret the data. This is where you’ll gain valuable insights into customer behavior and the effectiveness of your retention strategies.
Look for trends such as:
- Increasing Retention Rates: Indicates successful retention strategies.
- Decreasing Churn Rates: Shows that fewer customers are leaving.
- Stable or Increasing AOV: Suggests that your remaining customers are becoming more valuable over time.
- Consistent Purchase Frequency: Reflects strong customer loyalty.
By analyzing these trends, you can make informed decisions to improve customer retention and reduce churn.
Step 5: Turning data into action
Now, on to the good bits. Let’s see how we can turn all these insights into practical strategies and tactics that can take your retention engine from 1 to 100.
1. The First Purchase Cliff
Look at your retention rates between first and second purchases. Are you losing a significant portion of customers before they make their second purchase? This is a critical moment in the customer journey, often caused by unmet product expectations or lack of follow-up.
For example, if you're selling coffee and see a 70% drop-off before the product runs out, that's a red flag about your product experience or education.
Strategy Focus: Product Experience and Education
- Which cohorts show better retention? Study what was different about their first purchase experience
- Compare retention rates across product types. Are some products better at driving second purchases?
- Check if price points affect early retention
Example: A haircare brand noticed their $35 shampoo had a 40% repurchase rate, while their $18 shampoo had only 15%. Digging deeper, they found the premium product came with detailed usage instructions and a sample of complementary conditioner. This simple insight helped them revamp their entire first-purchase experience.
2. The Repurchase Window
Study when your best customers typically make their second purchase. This varies by product type–makeup might be 3 months, supplements 30 days, etc.
Strategy Focus: Timing and Communication
- Map retention rates against typical product duration
- Compare cohorts with different communication frequencies
- Analyze seasonal impacts on repurchase timing
Example: A coffee subscription brand discovered their highest-retaining cohorts received their replenishment reminder 7 days before their coffee usually ran out—not the standard 3 days they were using for all customers. Simple change, big impact!
3. Category Purchase Patterns
Look for correlations between multi-category purchasers and retention rates. This often reveals your most profitable customer journeys.
Strategy Focus: Product Journey Mapping
- Which product combinations show the highest retention?
- What's the typical timeframe between category purchases?
- How do different entry products affect long-term retention?
Example: An athleisure brand discovered customers who bought leggings first had 50% higher retention than those who bought tops first. Leggings buyers spent more time on fit research, leading to higher satisfaction with their first purchase.
4. Price Point Patterns
Analyze how first purchase value correlates with retention. Entry prices can heavily influence retention rates. If your lower-priced products are leading to higher churn, it indicates that they’re not delivering enough value or customers are not as committed.
Strategy Focus: Value Perception
- Compare retention rates across price points
- Analyze lifetime value by first purchase type
- Study discount impact on long-term behavior
Example: A skincare brand found that customers who started with their $85 serum had 3x better retention than those starting with their $25 cleanser. The higher investment led to more committed product usage and better results.
5. Seasonal Impact Analysis
Look for patterns in how acquisition timing affects long-term retention. Some cohorts might naturally perform better based on when they first purchased.
Strategy Focus: Seasonal Strategy Adaptation
- Compare retention across seasonal cohorts
- Analyze off-season engagement patterns
- Study holiday vs. non-holiday acquisition performance
Example: A swimwear brand discovered their March cohorts had 40% higher annual retention than October cohorts. Looks like October purchasers were mostly deal hunters.
Building your Retention Strategy
With the right cohort reports, you can gain invaluable insights into customer behavior, identify trends, and make data-driven decisions to improve retention. If you’re using Peel Insights, you get all kinds of cohort reports right out of the box. While Google Analytics gives you a fair amount of data, it’s nowhere close to the amount of multi-dimensional insights that the reports in Peel Insights can provide you.
- Customer Behavior Reports
- Order Frequency Reports
- Revenue Reports
Each of these categories contains several reports and provides unique insights that can inform different aspects of your retention strategy.
Let's discuss how to use them together to build a comprehensive retention strategy:
Reward your best customers
Analyze lifetime revenue (LTR), total revenue, and order frequency cohort reports to find your best customers. These are the ones you should try and retain at all costs.
Segment these high-value customers and retain them through loyalty programs, exclusive access to new products, and personalized experiences. For example, if you discover that your top 10% of customers generate 50% of your revenue, consider creating a VIP club that offers early access to sales, special discounts, and personalized recommendations.
- Introduce a points system where they can earn rewards
- Create exclusive "member-only" products or early access to new releases
- Offer a discount for long-term commitments (annual subscriptions, if you’re a subscription brand)
Understand purchase patterns
Understanding when your customers are most likely to make repeat purchases is crucial for timing your marketing efforts effectively. Analyze order frequency and repurchase rate reports to find these patterns.
Schedule your marketing campaigns and automation around peak purchase times to maximize engagement and sales. For example, if data shows that customers typically make a second purchase within 30 days, send a personalized follow-up email with product recommendations and a discount code around this time.
Pro-tip: Export these segments directly into Klaviyo and Attentive and tweak your automation for these segments so your emails and SMS are a lot more personalized and relevant.
Personalize your approach
Segment your customers by Average Order Value (AOV) and discount sensitivity using relevant reports. High AOV customers might appreciate exclusive product launches, while discount-sensitive customers might respond better to special offers and discounts.
Use your cohort data to tailor the experience:
- If you notice certain cohorts prefer specific products, create targeted recommendations.
- For cohorts with lower purchase frequency, send gentle reminders or special offers.
- Celebrate "milestones" with special perks (6 months, 1 year, etc.).
Optimize your product mix
Identify which products are driving repeat purchases and higher lifetime value (LTV). Focus your marketing efforts on promoting these high-performing products to new and existing customers.
Ensure you have sufficient inventory of popular products and highlight them in your marketing campaigns. If a particular product has a high repurchase rate, feature it prominently in your email newsletters and social media campaigns to attract new customers and encourage repeat purchases.
Improve customer experience
Look at refund rates and repurchase rates to identify cohorts with high refund rates or declining repurchase rates. Investigate potential issues with product quality, shipping, or customer service that might be causing dissatisfaction.
Enhance your customer support processes to address and resolve issues quickly. Here’s what you can do:
- Conduct regular surveys to gauge satisfaction and gather improvement ideas
- Create a community where customers can share experiences and tips
- Be transparent about changes you're making based on customer feedback
Remember that three-month mark? Here's how to improve early retention:
- Create a comprehensive onboarding sequence. Think personalized welcome videos, tutorials, or guides.
- Send a surprise "welcome to the club" gift or coupon in month two.
- Check in at the start of month three with a survey. Ask about their experience and address any concerns.
Predict and prevent churn
Monitor the “Days Since First Order” and repurchase rate reports to identify the average time frame when customers are most likely to churn. Set up automated retention campaigns to engage customers before they reach this critical churn point. This could include personalized emails, special offers, or loyalty rewards.
For example, if customers typically churn after 60 days without a purchase, send a re-engagement email with a special offer around the 50-day mark to encourage them to return.
For those who do churn, all is not lost:
- Create specific win-back campaigns for each cohort based on when they churned.
- Offer a "we miss you" discount or a free product.
- Share what's new since they left – new features, improved products, etc.
Measure and iterate
Regularly review your cohort reports, especially rolling 30-day metrics, to measure the impact of your retention efforts. Use the insights gained from these reports to continuously refine and improve your retention strategies.
Implement A/B testing for different retention strategies to determine what works best for your audience. For example, if you notice that a particular retention campaign significantly boosts repurchase rates, consider expanding it or applying similar tactics to other segments.
Your turn to act
You now have the tools to leverage cohort analysis in your churn prevention efforts. Remember these key steps:
- Set up your cohorts based on meaningful segments
- Track the right metrics over time
- Look for patterns and trends in your data
- Develop targeted strategies for different cohorts and stages
- Continuously test, learn, and improve
With cohort analysis in your toolkit, you'll be well-equipped to improve customer retention and drive sustainable growth for your D2C brand. It's time to grind down that churn and brew up some serious customer retention!
.png)


.svg)