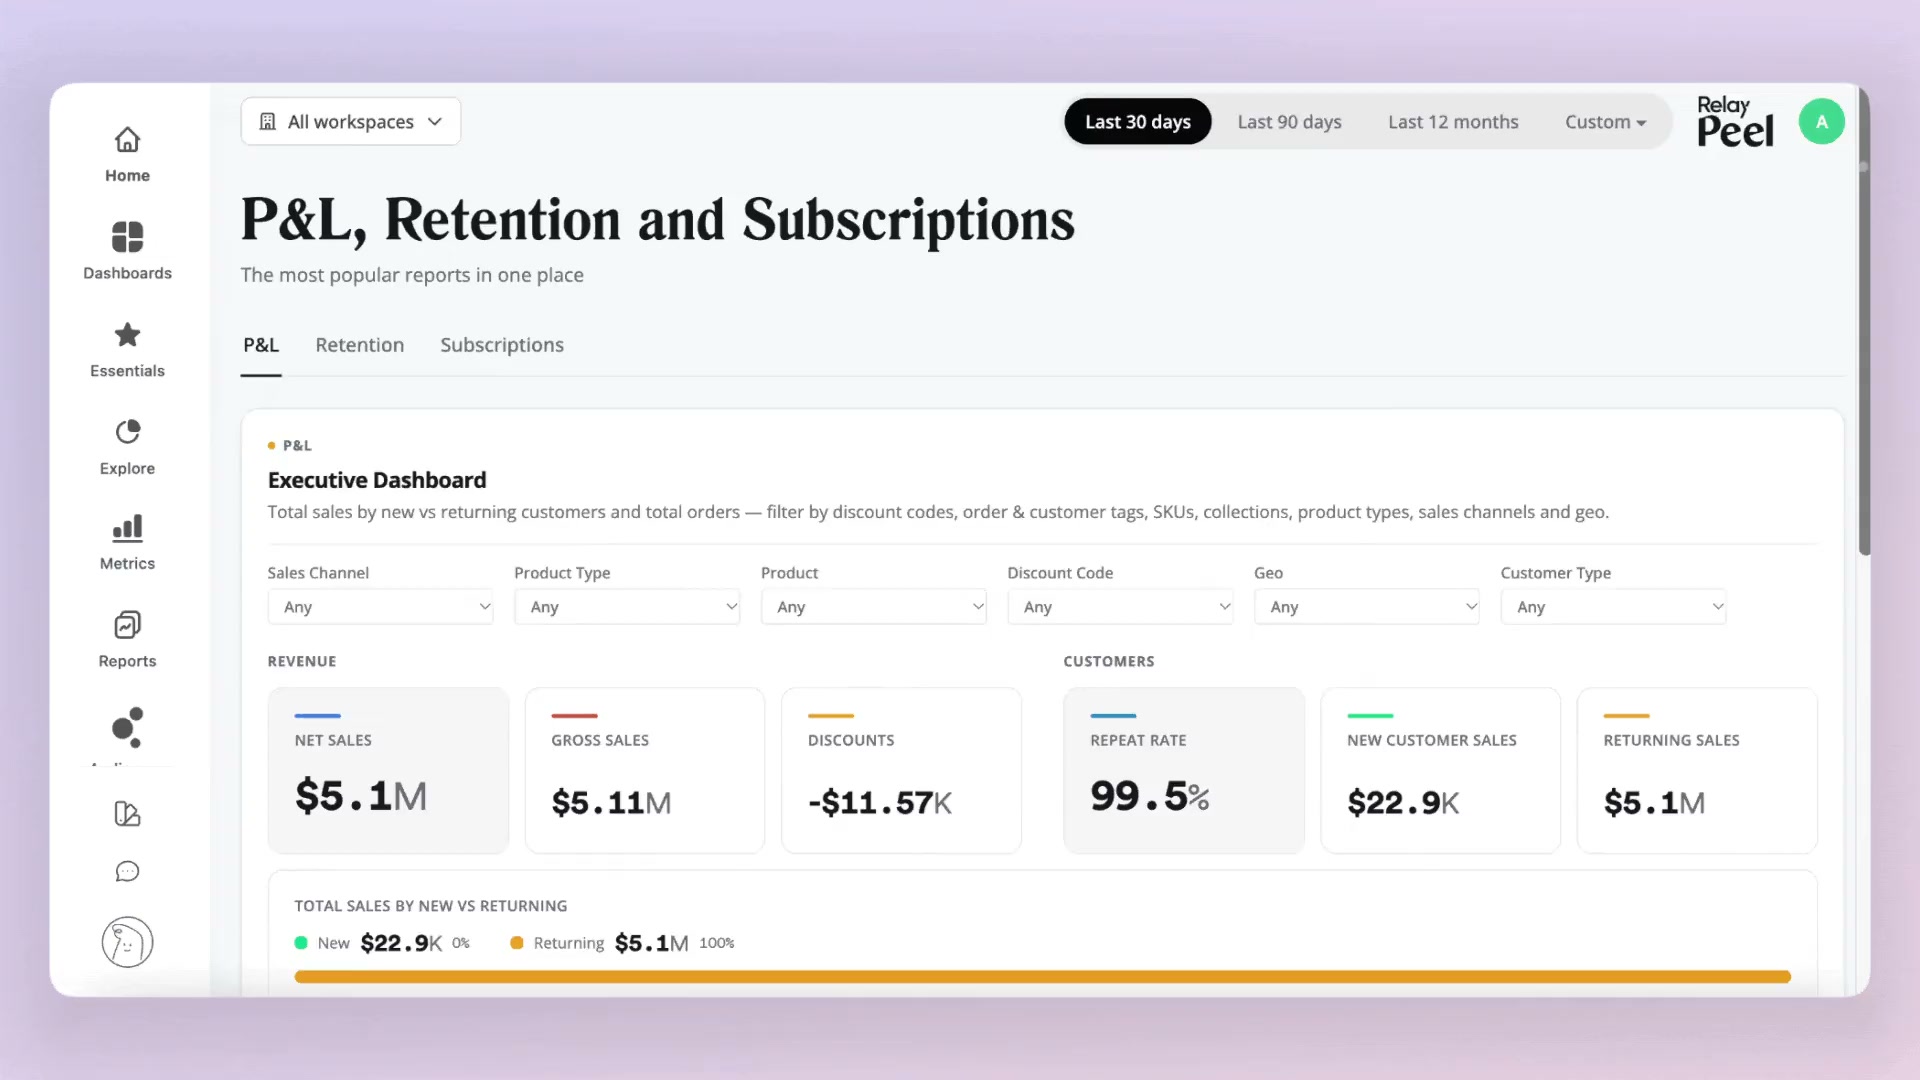
Meet your new Peel Insights homepage
We've made it easier to find the insights that matter.
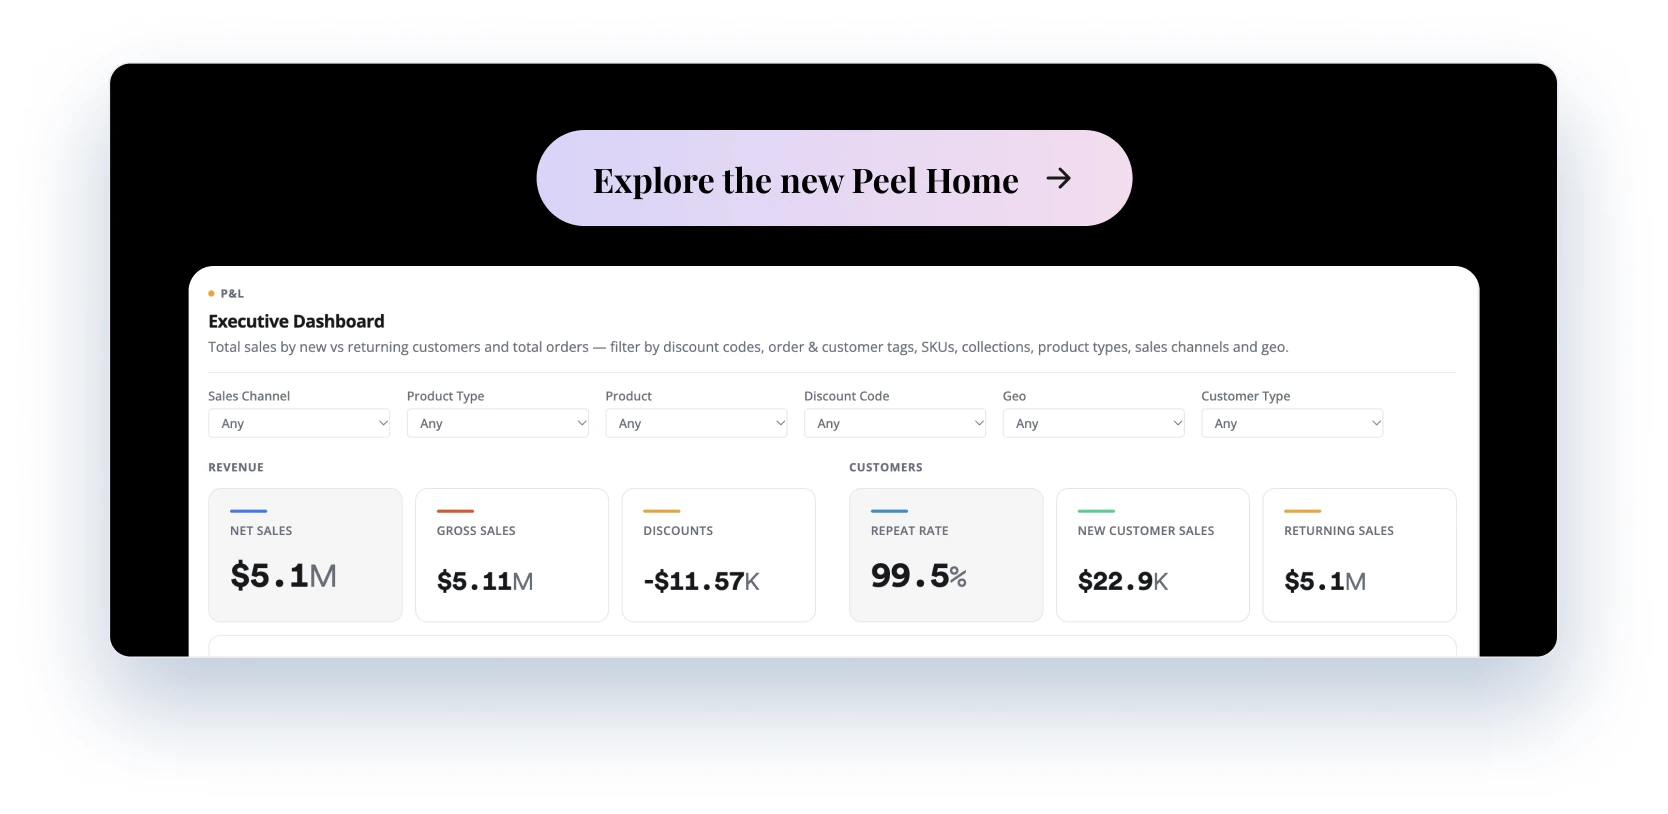
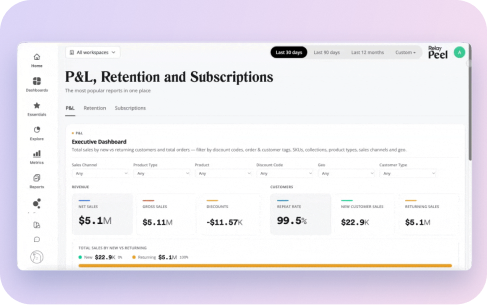
The new Peel homepage brings your most-used reports together in one simple, easy-to-navigate experience. Get a quick overview of your business, find the reports you need, and dive deeper into the metrics that matter most.
We've also introduced new reports and more granular metrics across P&L, Retention, and Subscriptions, helping you better understand your revenue, marketing efficiency, customer behavior, and product performance.
Less time digging through data. More time knowing what to do with it.
“Really really nice job. This makes everything digestible and accessible.” Alex, Head of Growth, Waterboy
P&L
Know what's driving your business
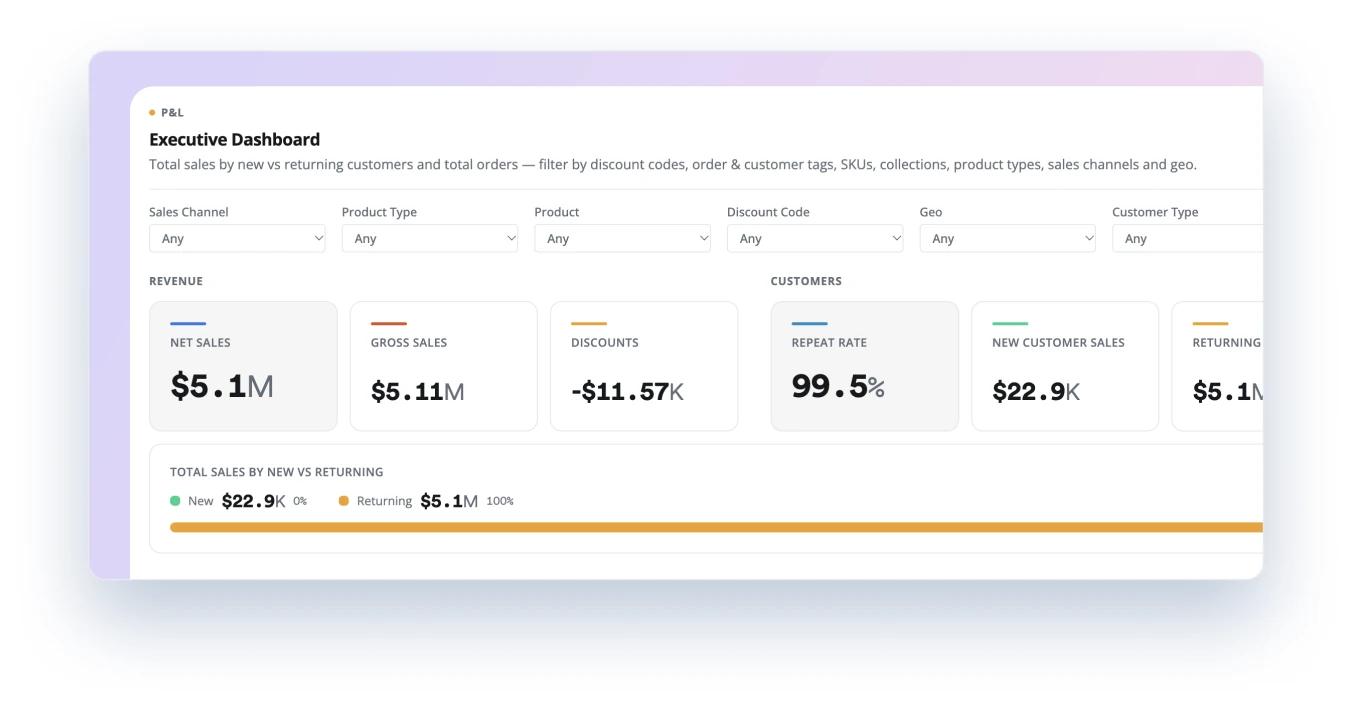
The P&L tab shows where your revenue comes from and what you spend to get it. Three views, each one click away from the full report.
- Get a clearer picture of your revenue: Go beyond total sales to understand how your business is performing. See what's contributing to growth, identify where performance is changing, and know where to focus.
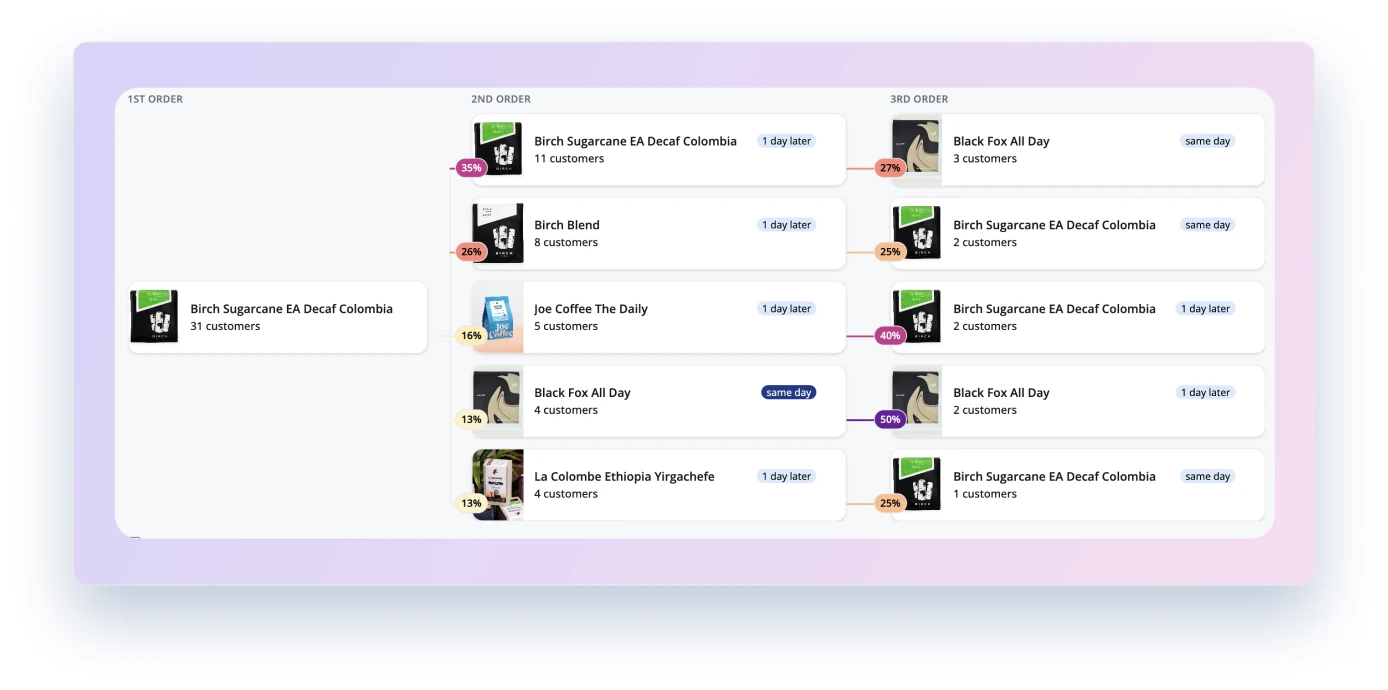
- Follow the Customer Purchasing Journey (NEW!): Our new Customer Purchasing Journey report makes it easy to visualize how customers move from their first purchase to their next. Understand which products work best as first purchases, what customers buy afterward, and where the biggest repeat-purchase opportunities are.
- See where your marketing spend goes: Get a clearer view of marketing spend, revenue, and orders across your channels.
Retention
Understand what brings customers back
We've expanded Retention with new reports and more detailed customer and product-level metrics. Now you can go beyond your overall retention rate to understand who your most valuable customers are, what they buy, and which products actually drive repeat purchases.
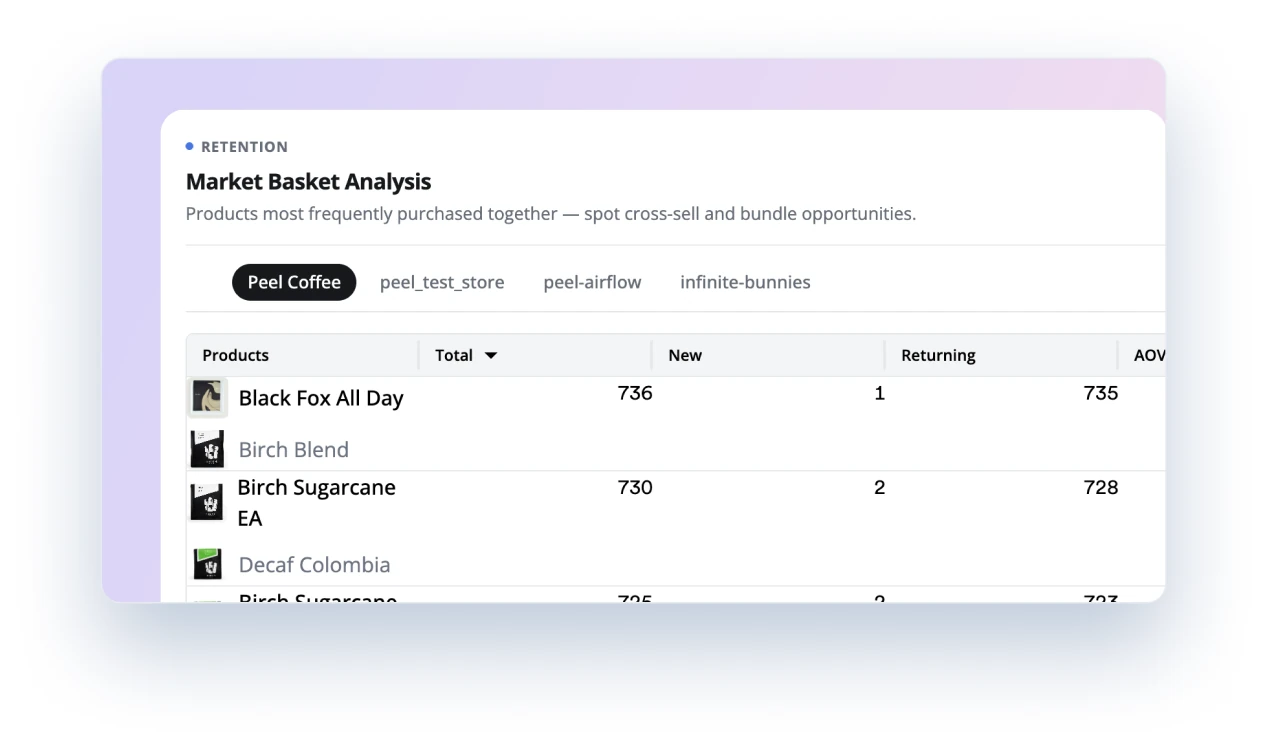
- Discover Which Products Sell Best Together (NEW!): See which products customers frequently purchase together, switch between stores, and identify cross-sell and bundle opportunities to grow AOV.
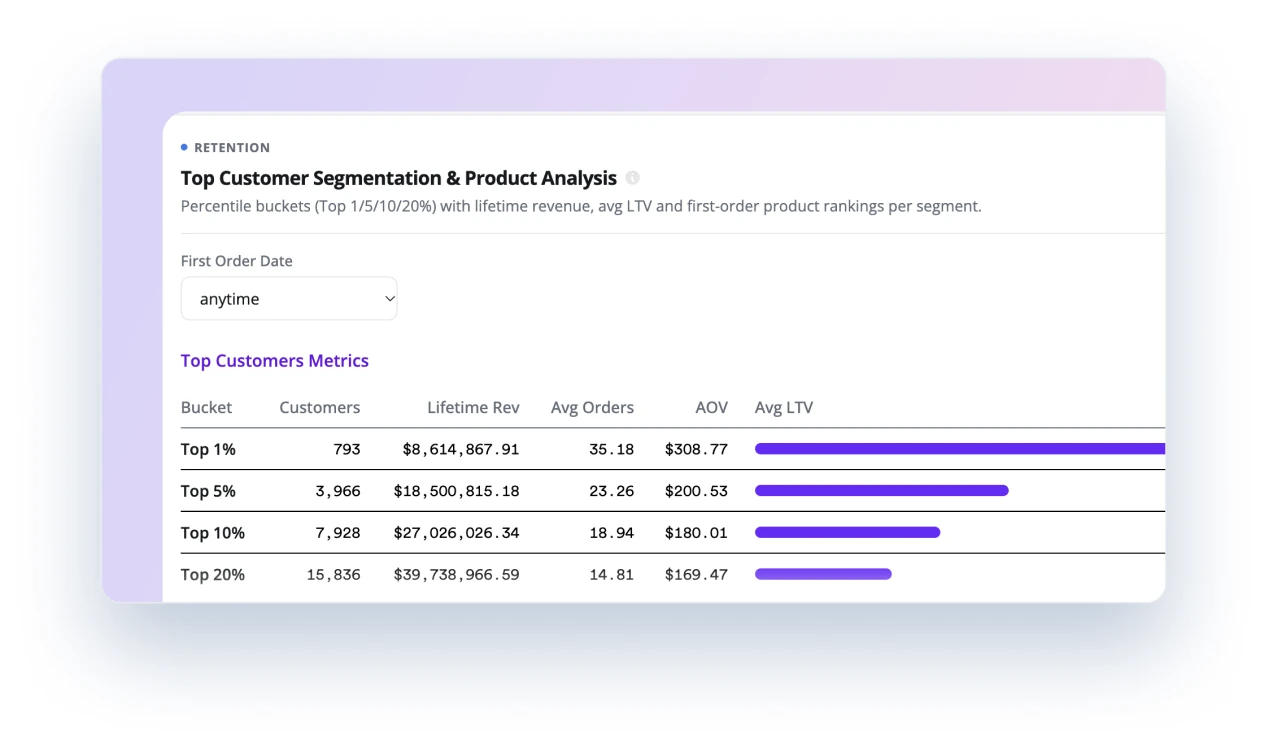
- Get to Know Your Most Valuable Customers (NEW!): Break customers into top 1%, 5%, 10%, and 20% segments. Compare lifetime revenue, orders, AOV, LTV, repeat purchase rates, and first-order products to see what your best customers have in common.
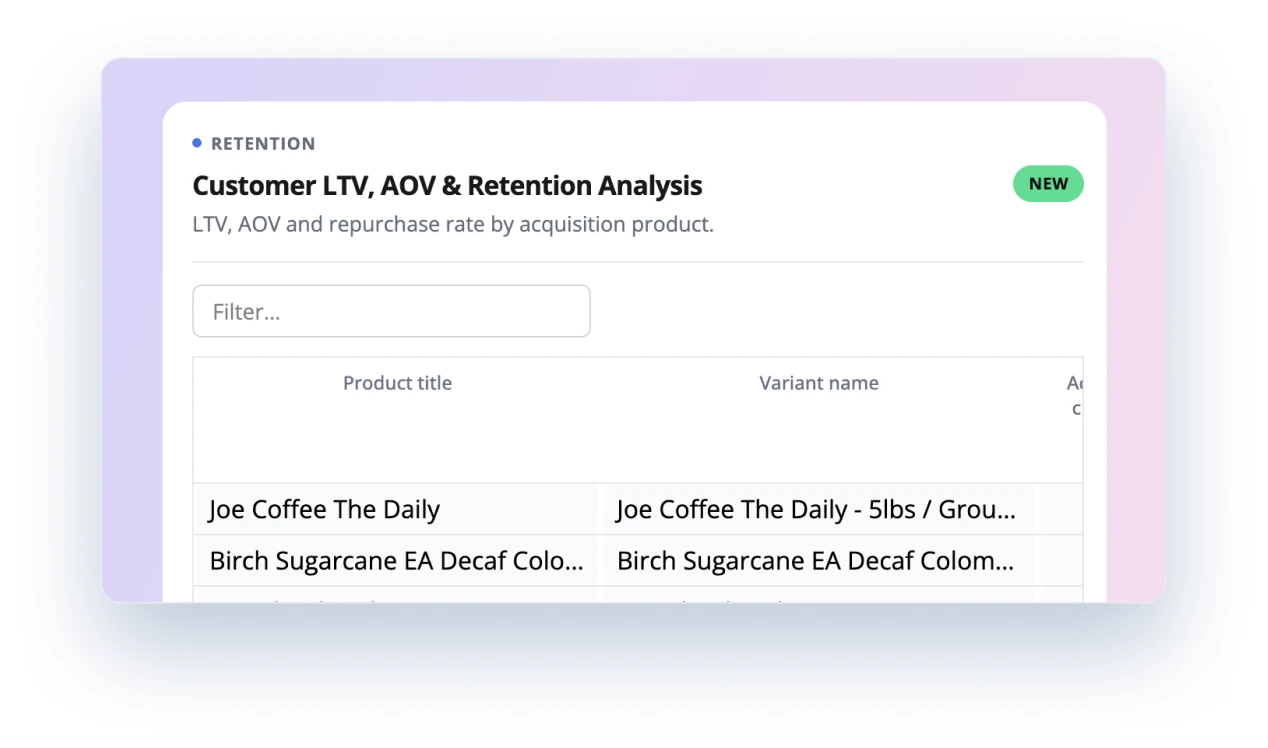
- Understand LTV, AOV, and retention by product (NEW!): See which products bring in high-value customers and drive repeat purchases. Compare customer LTV, AOV, and repurchase rates by acquisition product to identify what's driving long-term growth.
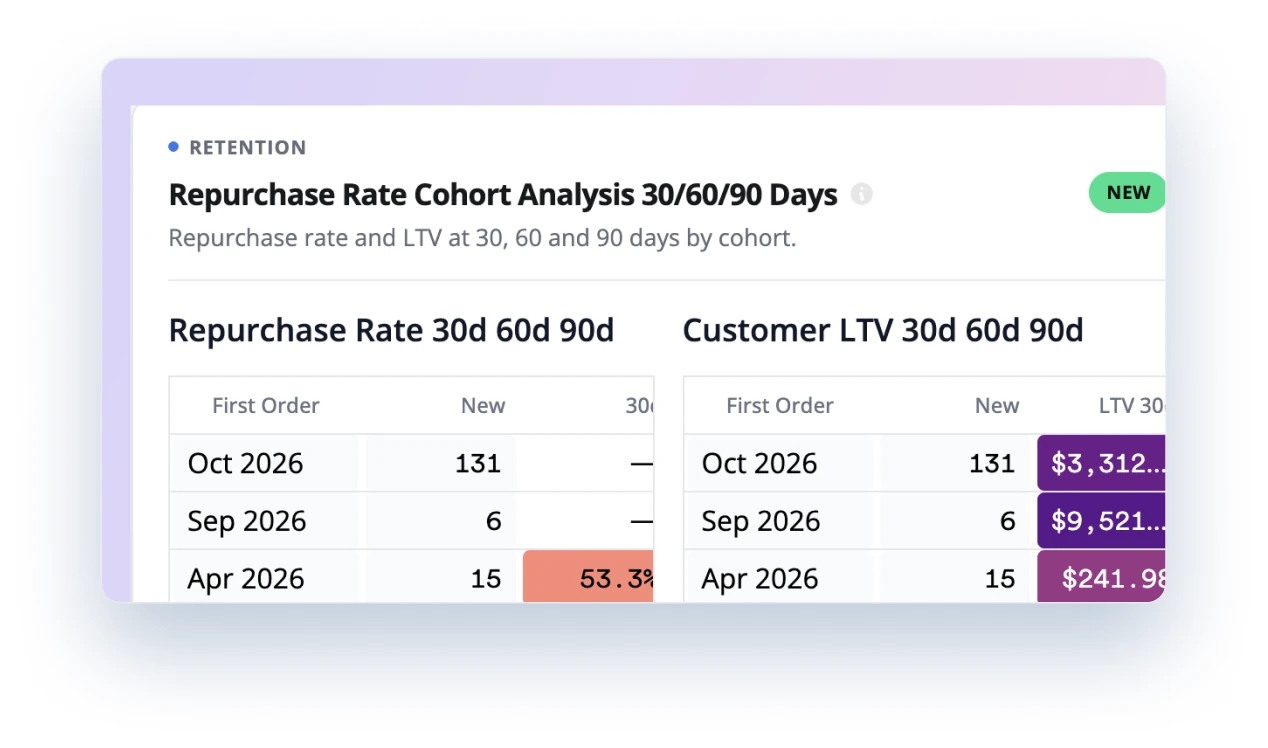
- See when customers come back (NEW!): Track 30, 60, and 90-day repurchase rates and LTV by cohort. Understand how quickly customers return, how their value grows, and whether retention is improving.
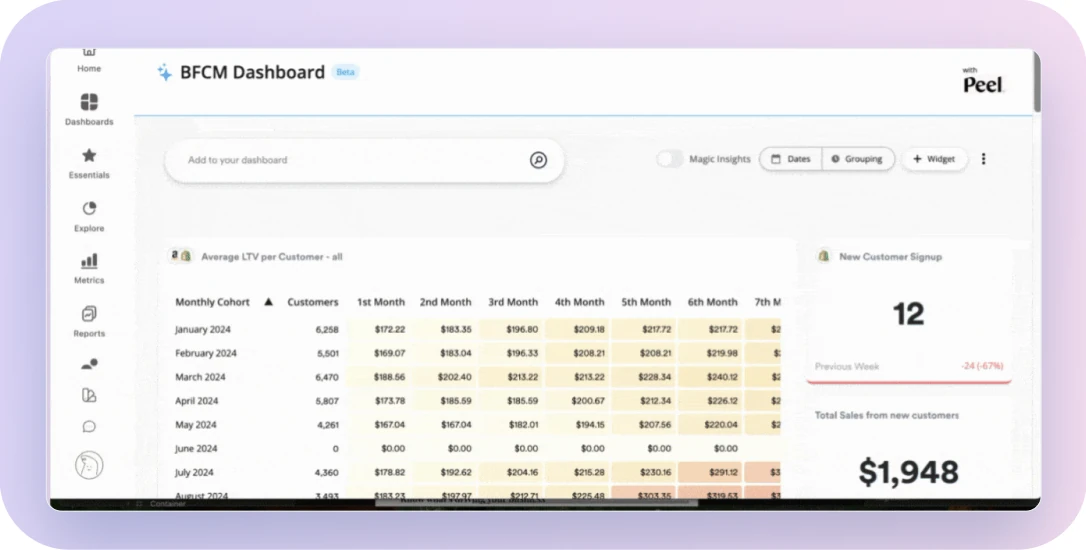
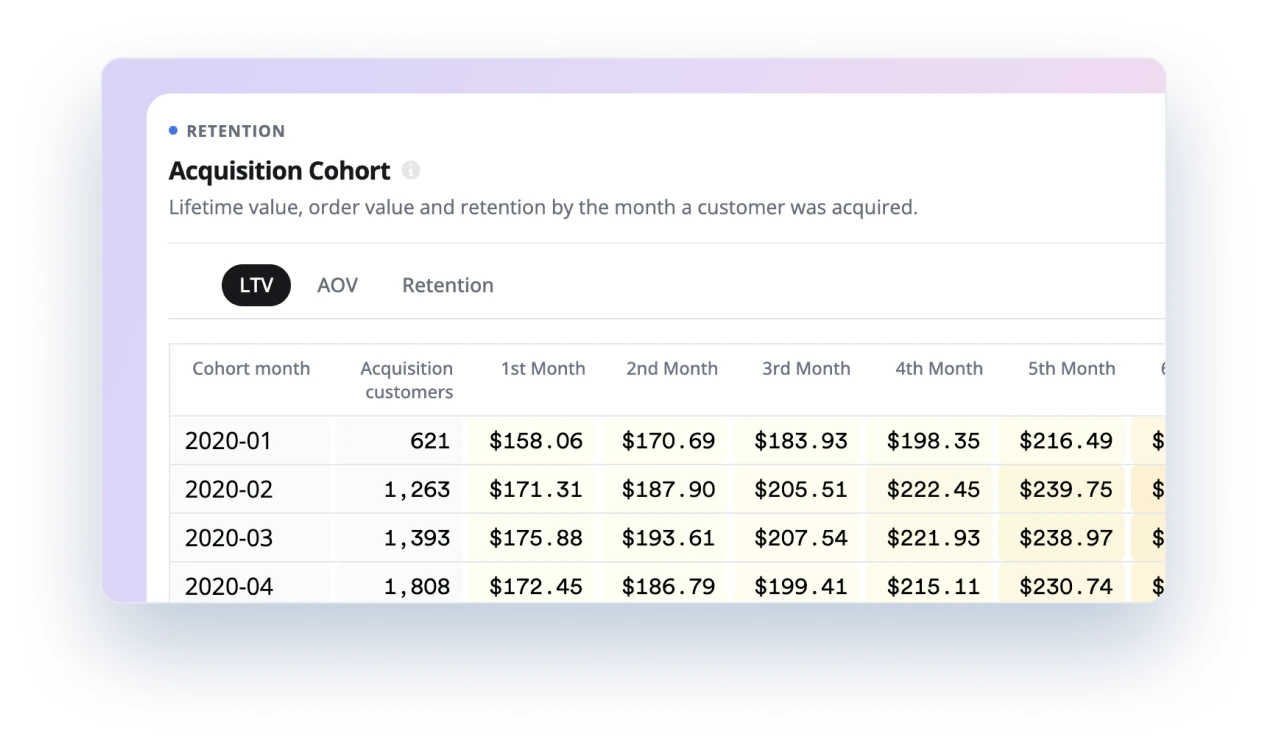
- Understand How Customer Value Grows Over Time: Track customer LTV, AOV, and retention by acquisition month. See how customer value evolves over time and compare the long-term performance of different cohorts.
Subscriptions
Turn one-time buyers into long-term customers
Get a clearer picture of your subscription business. Understand how subscribers contribute to revenue, which products turn one-time buyers into subscribers, and how customer value differs across purchase types.
- Understand One-Time vs. Subscription Revenue: See how your customers and revenue break down between one-time purchases and subscriptions, so you can understand the role recurring purchases play in your business.
- Discover Which Products Drive Subscriptions: Identify which first-purchase products are most likely to turn one-time buyers into subscribers. Spot opportunities to improve subscription conversion and grow recurring revenue.
- Compare Customer Lifetime Value by Type: Compare LTV across one-time buyers and subscribers by acquisition cohort. Understand how customer value differs by purchase type and where your most valuable customers come from.
- See how retention differs by customer type: Compare monthly repurchase retention for customers whose first order was a one-time purchase versus a subscription. Understand how purchasing behavior differs over time.
- Know which products turn buyers into subscribers: See how many customers each first-purchase product attracts, what percentage go on to subscribe, and their repurchase rates. Identify which products create the strongest opportunities for subscription growth.
A simpler way to find your next opportunity
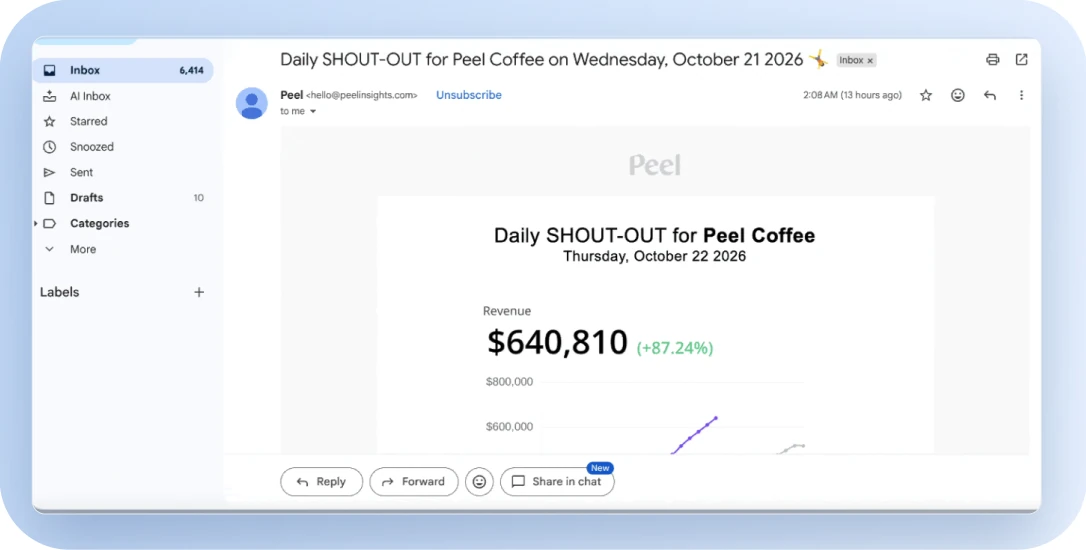
Whether you're checking daily performance, figuring out which products drive repeat purchases, or looking for ways to improve customer lifetime value, the new Peel Home helps you get to the answers faster.
All your reports. More insights. One place to understand your business.